trader station
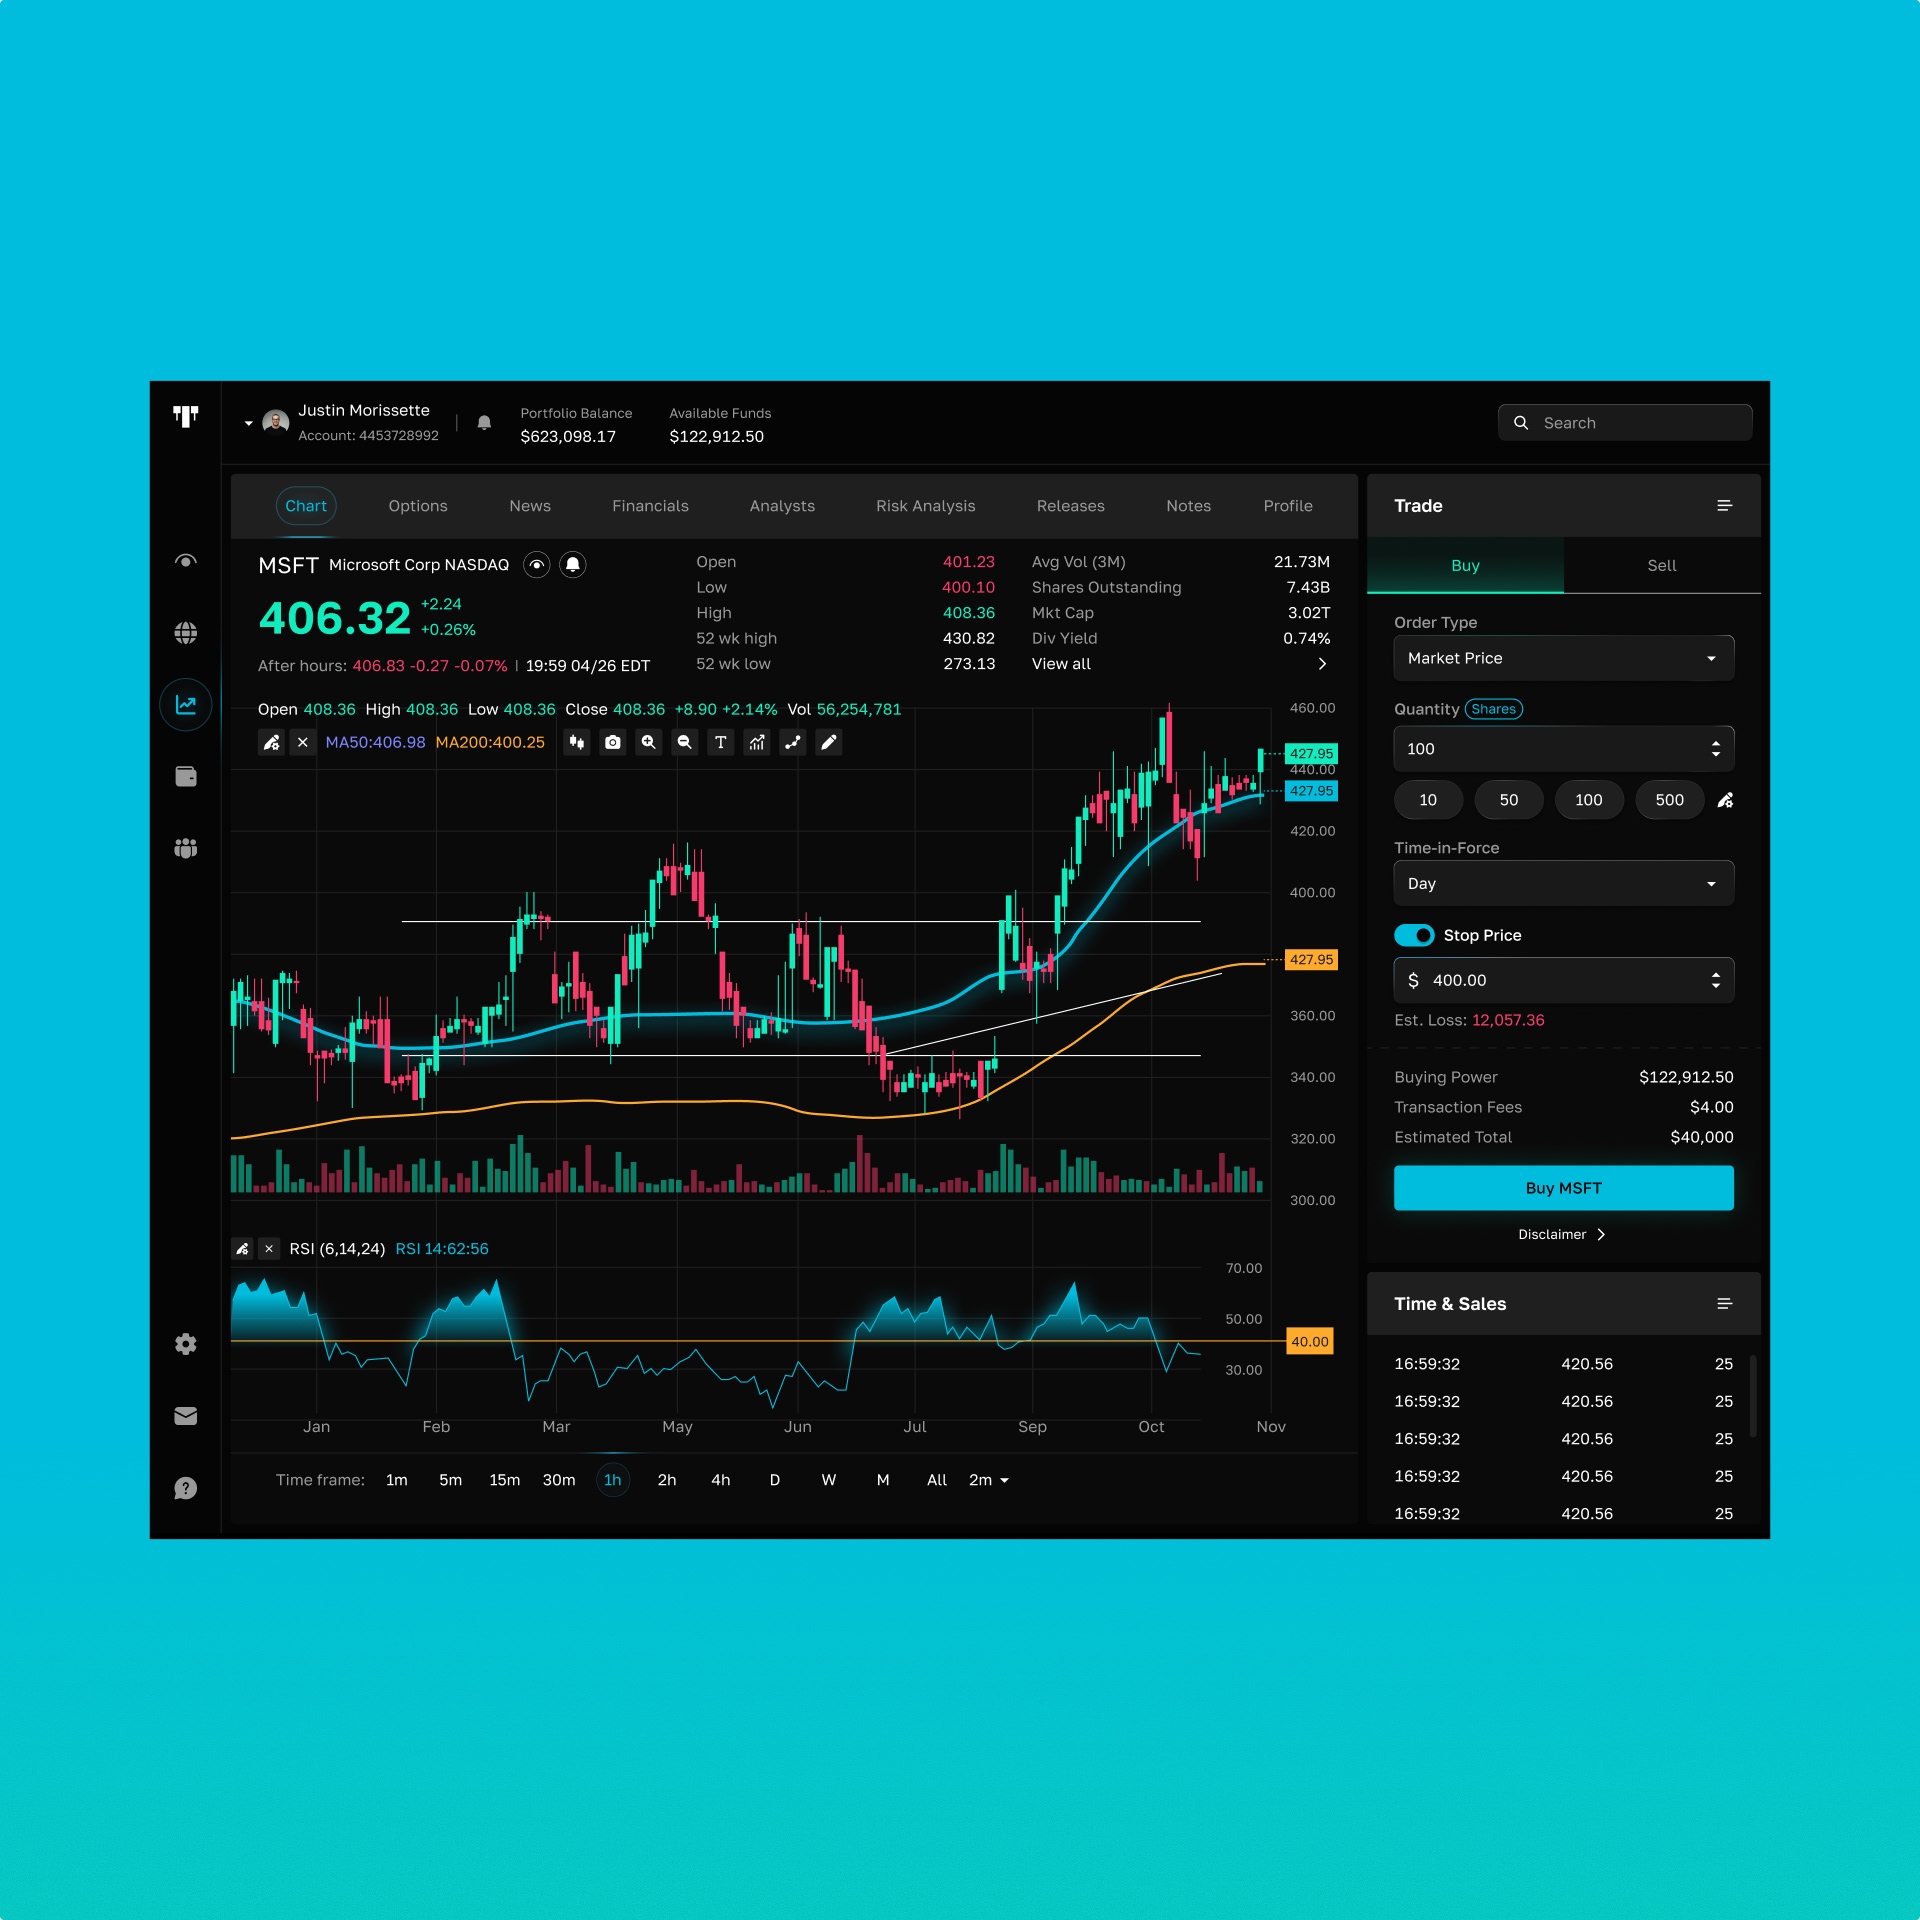
Trader Station is a conceptual dashboard designed for monitoring and managing algorithmic trading strategies. The interface brings together market charts, automated trading signals, portfolio performance, and risk analytics in one centralized environment.
The goal of the project was to create a system where traders can quickly understand complex market data and react to signals without navigating multiple tools or screens.
Interface Architecture & Visual System
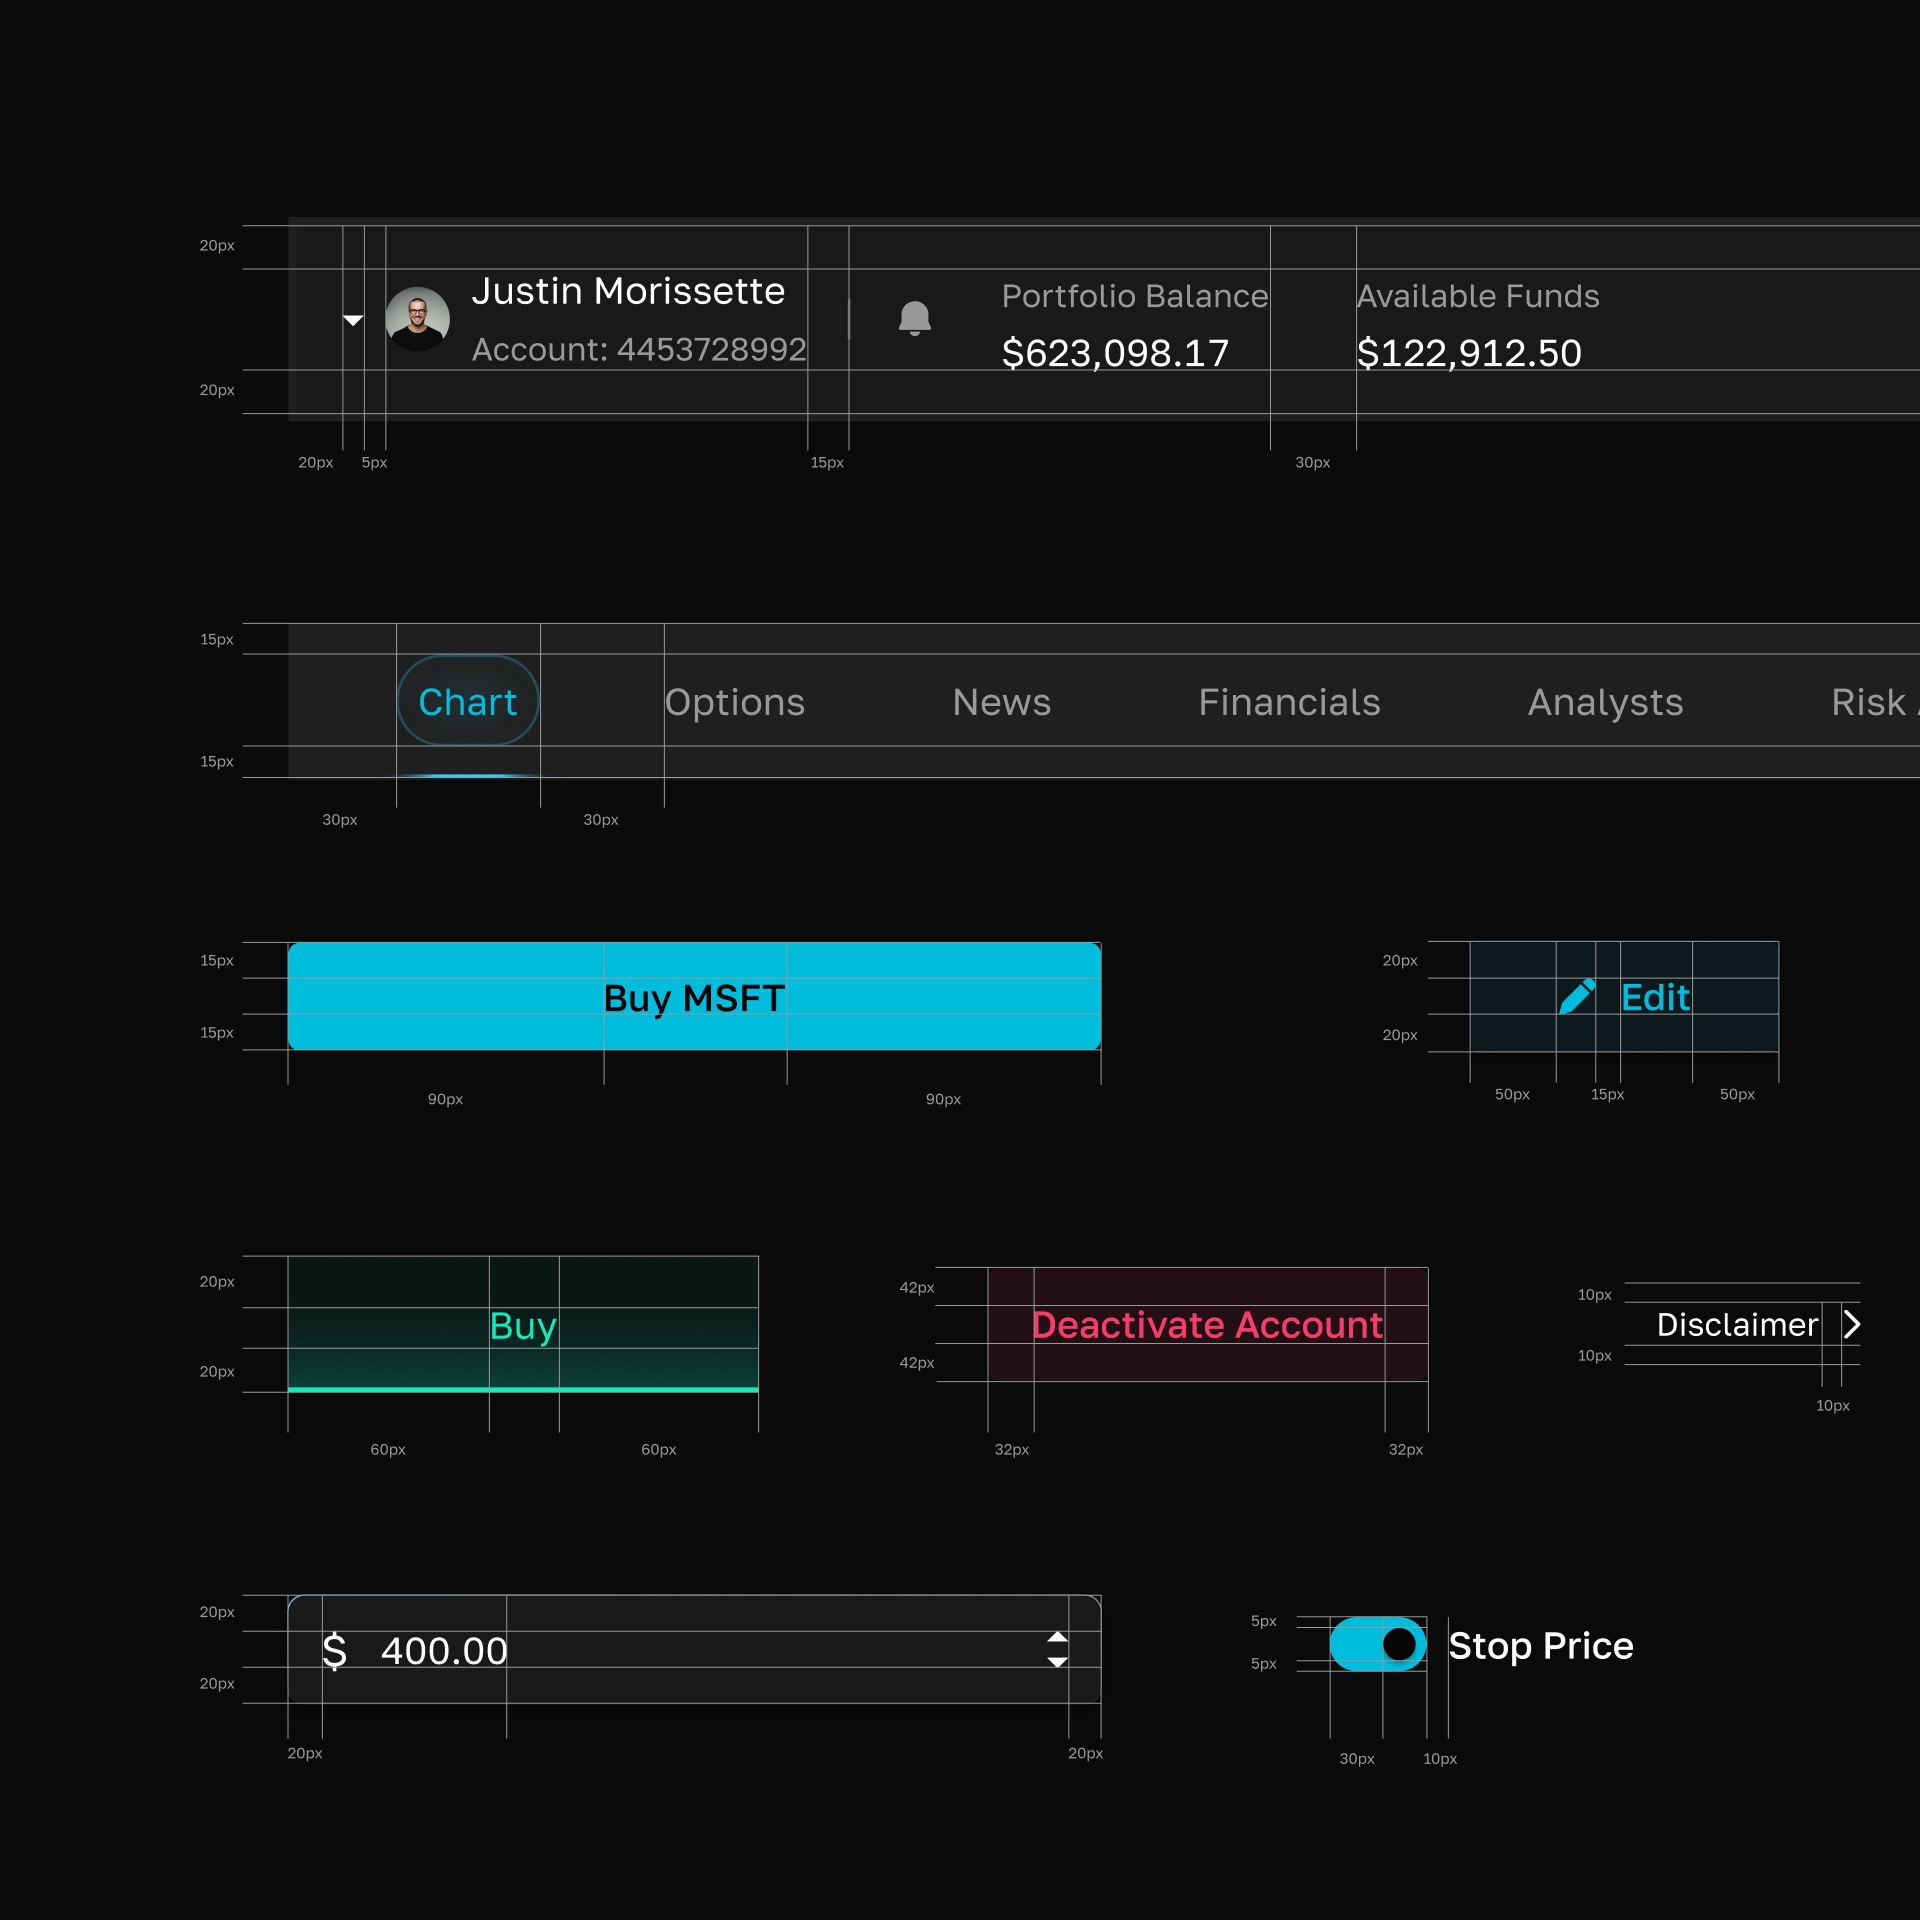
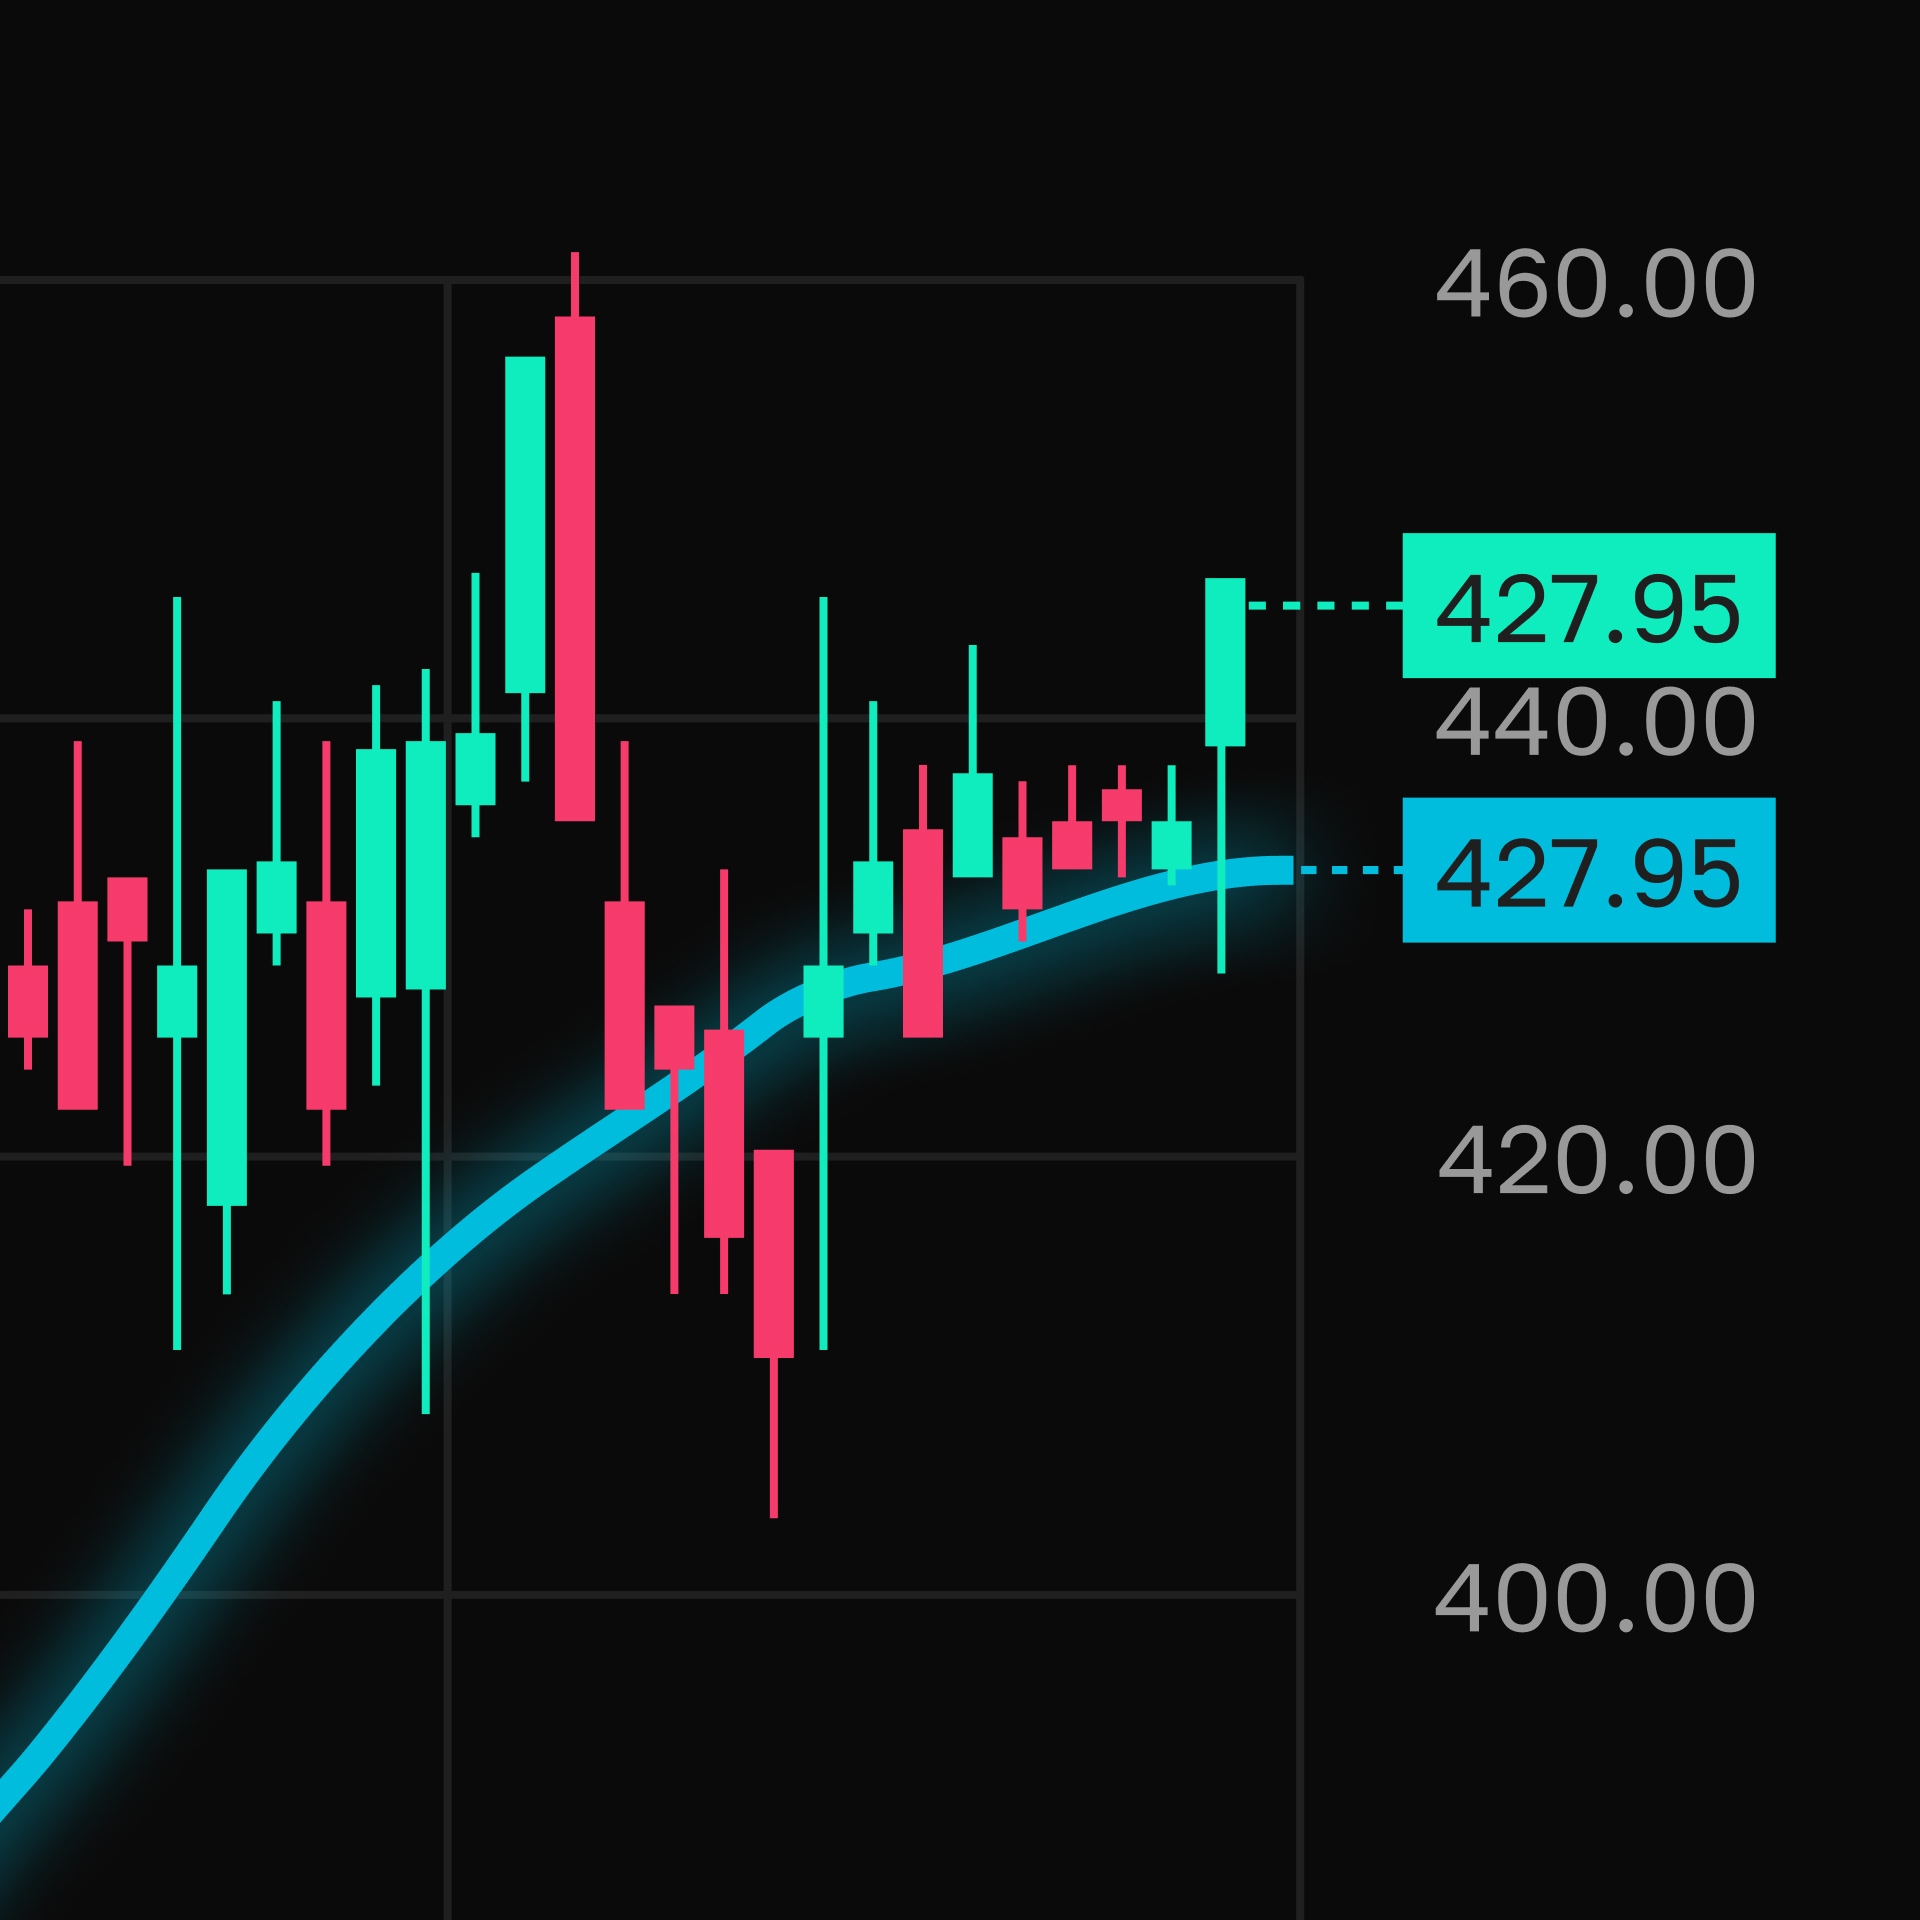
To ensure consistency across the interface, a modular design system was created. Core components include metric cards, chart modules, signal indicators, data tables, and alert badges. A simple color logic was used throughout the system: green for positive trades or buy signals, red for losses or sell signals, amber for warnings, and blue for neutral market data.
Together, the wireframes, visual language, and component system create a scalable dashboard capable of supporting complex financial analytics while remaining clear and readable.
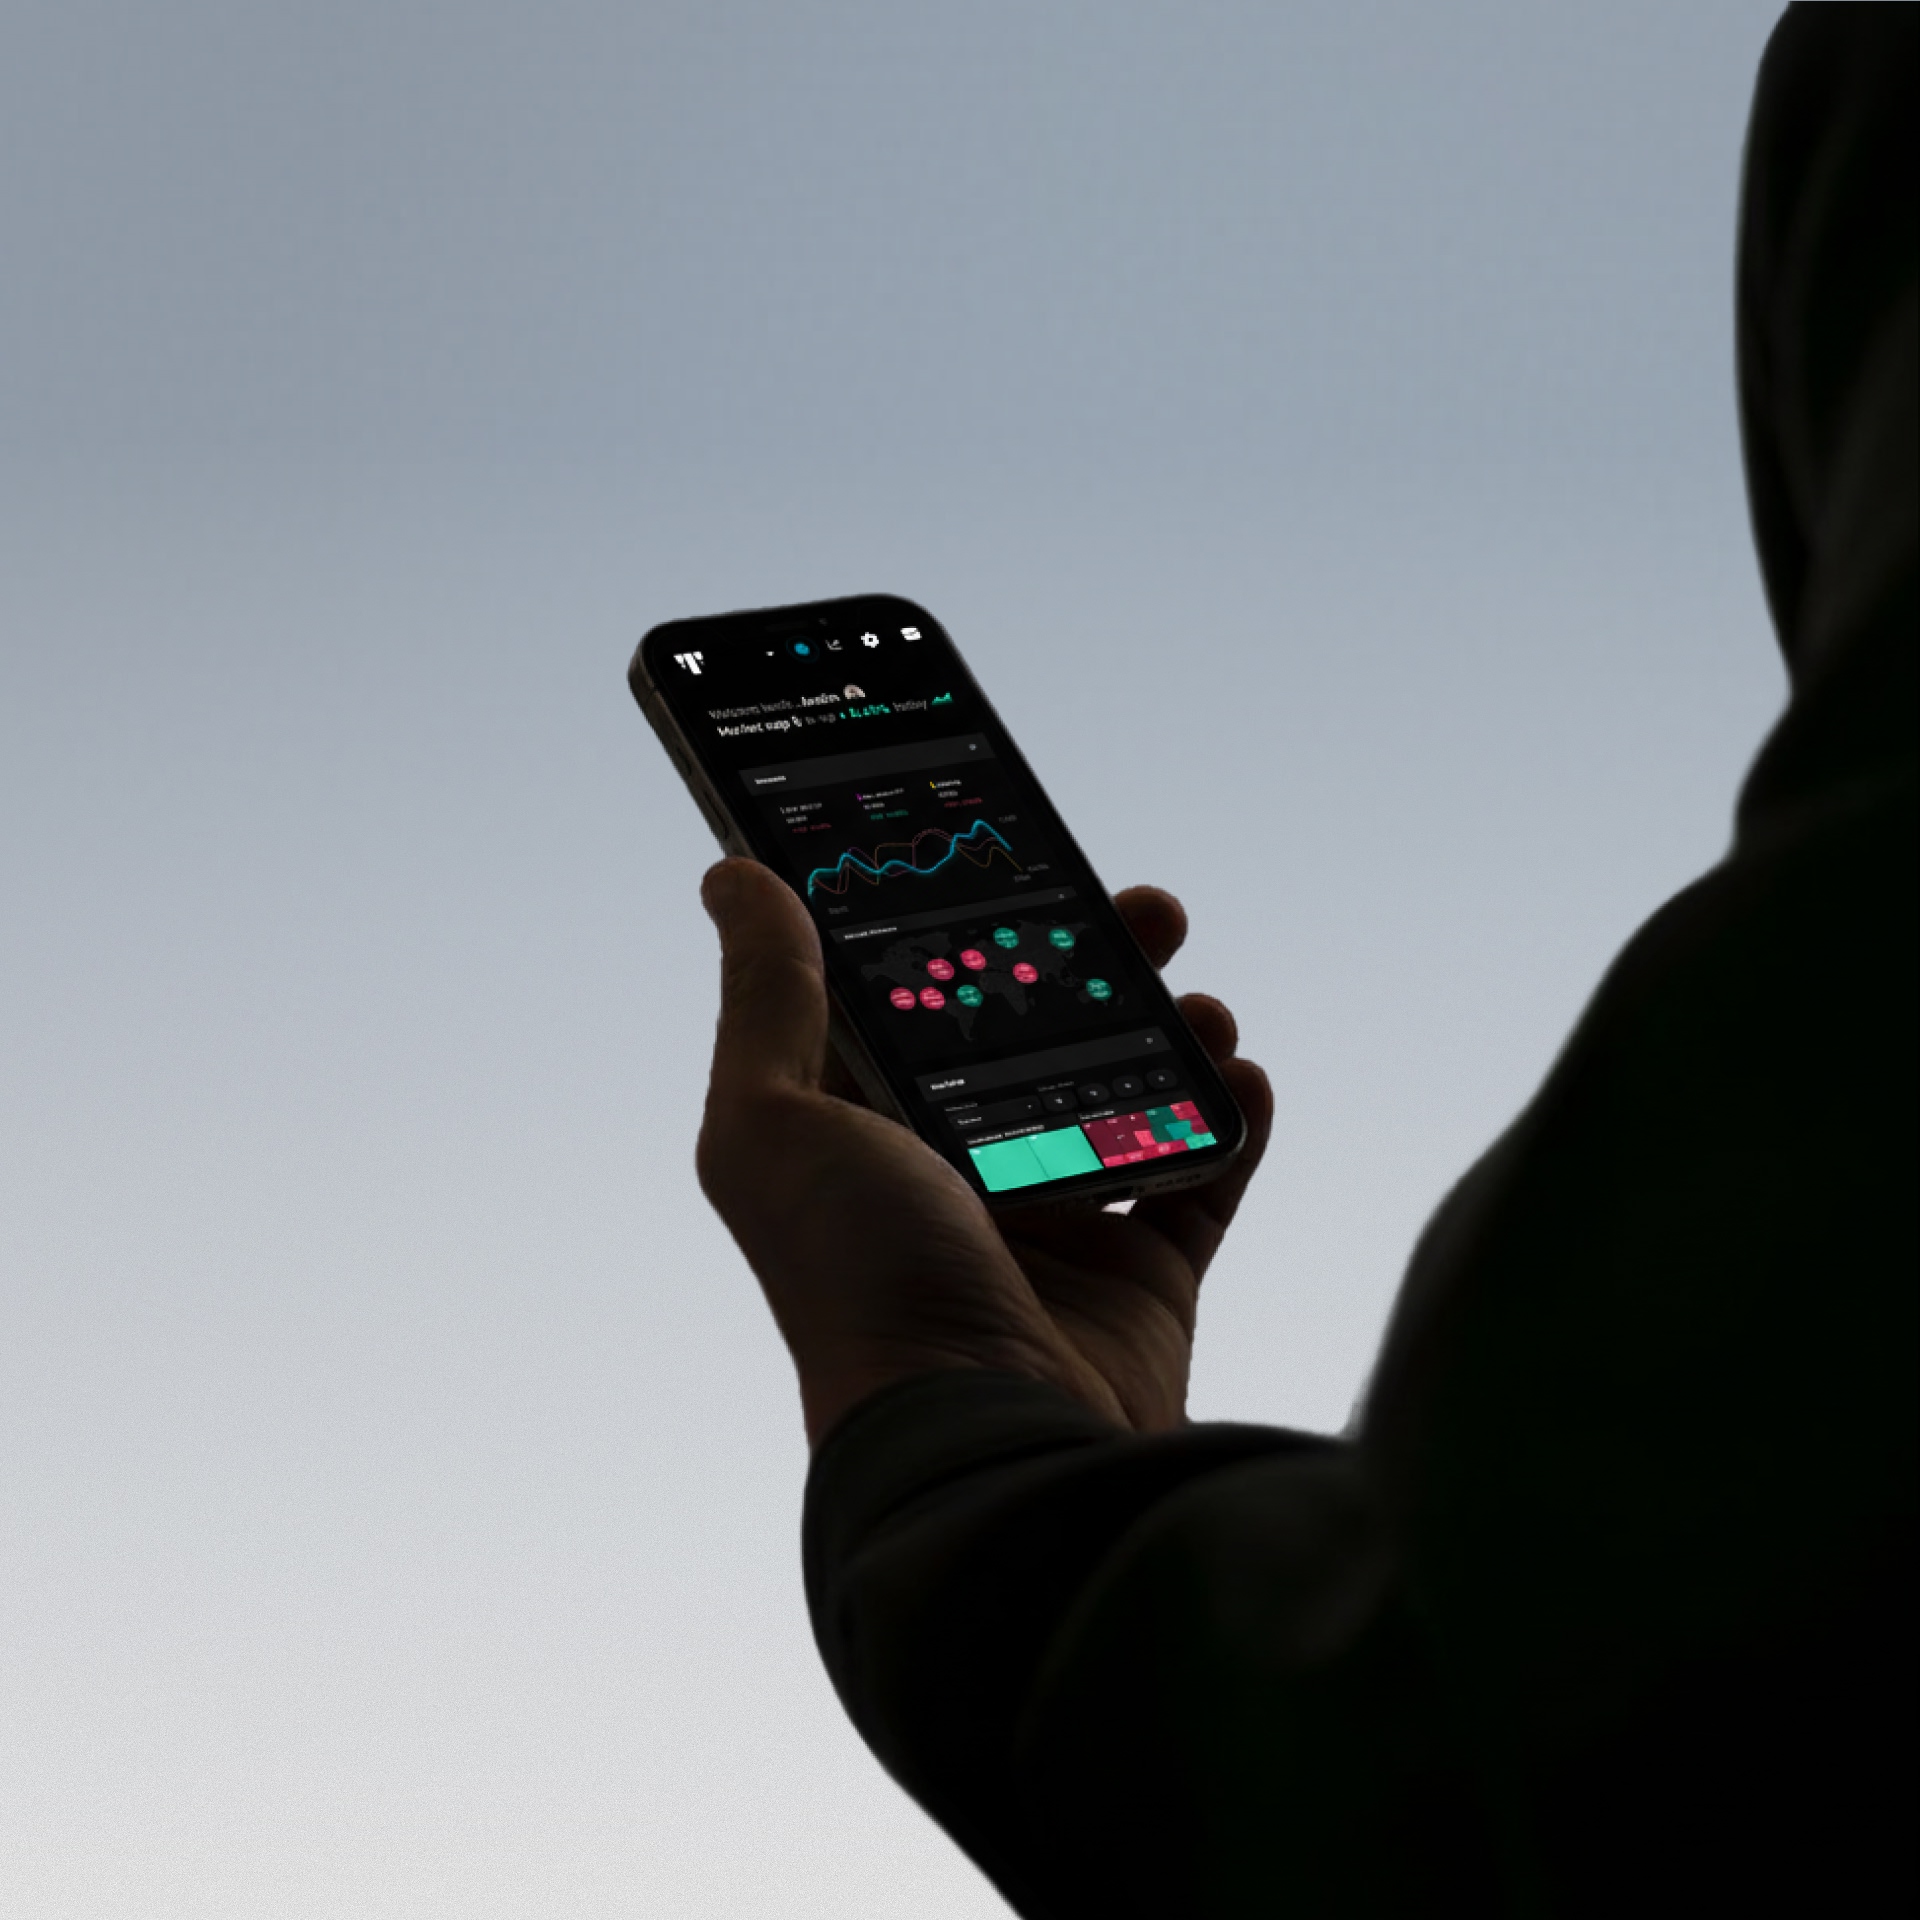
From these wireframes, the visual design evolved into a minimal, high-contrast interface inspired by professional trading terminals. A dark UI helps reduce eye strain during long trading sessions, while accent colors highlight important information such as buy and sell signals, profit and loss, and risk alerts.
A. Role
Product Designer, UX, UI, and data visualization design.
B. Tools
Figma · jitter · Prototyping · Data visualization · Interface systems.
C. Timeline
Concept project, 2 weeks from initial wireframes to final interface.